Story Visualizations Released
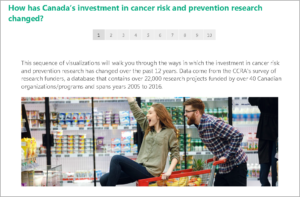 As companions to our 2016 special topic reports, CCRA has released interactive ‘story visualizations’ using Tableau software. Story visualizations are dashboards that are linked sequentially. They walk users through a series of analyses, each with greater detail, and allowing users more opportunity to ‘interact’ with the data. We welcome your feedback!
To access these tools, click here.
CIHR Operating Grant: Addressing the Wider Health Impacts of COVID-19
 Launched in early September, this funding opportunity seeks research proposals to address the gaps in knowledge about the wider impacts of the COVID-19 pandemic and response on the health and health care of people in Canada. Suspension/interruption of cancer screening is one of the research areas... Read More »
Story Visualizations Released
As companions to our 2016 special topic reports, CCRA has released interactive 'story visualizations' using Tableau software. Story visualizations are dashboards that are linked sequentially. They walk users through a series of analyses, each with greater detail, and allowing users more opportunity to ‘interact’ with ... Read More »
As companions to our 2016 special topic reports, CCRA has released interactive 'story visualizations' using Tableau software. Story visualizations are dashboards that are linked sequentially. They walk users through a series of analyses, each with greater detail, and allowing users more opportunity to ‘interact’ with ... Read More »