Story Visualizations Released
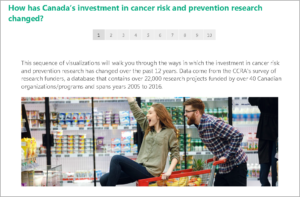 As companions to our 2016 special topic reports, CCRA has released interactive ‘story visualizations’ using Tableau software. Story visualizations are dashboards that are linked sequentially. They walk users through a series of analyses, each with greater detail, and allowing users more opportunity to ‘interact’ with the data. We welcome your feedback!
To access these tools, click here.
New Section on PartnershipAgainstCancer.ca
 The Partnership is pleased to announce a brand new section - Topics - on its website PartnershipAgainstCancer.ca. Topics is now home to the most valuable information from Cancerview.ca, which ha... Read More »
The Partnership is pleased to announce a brand new section - Topics - on its website PartnershipAgainstCancer.ca. Topics is now home to the most valuable information from Cancerview.ca, which ha... Read More »